


From start to finish: the five key points of a perfect roast
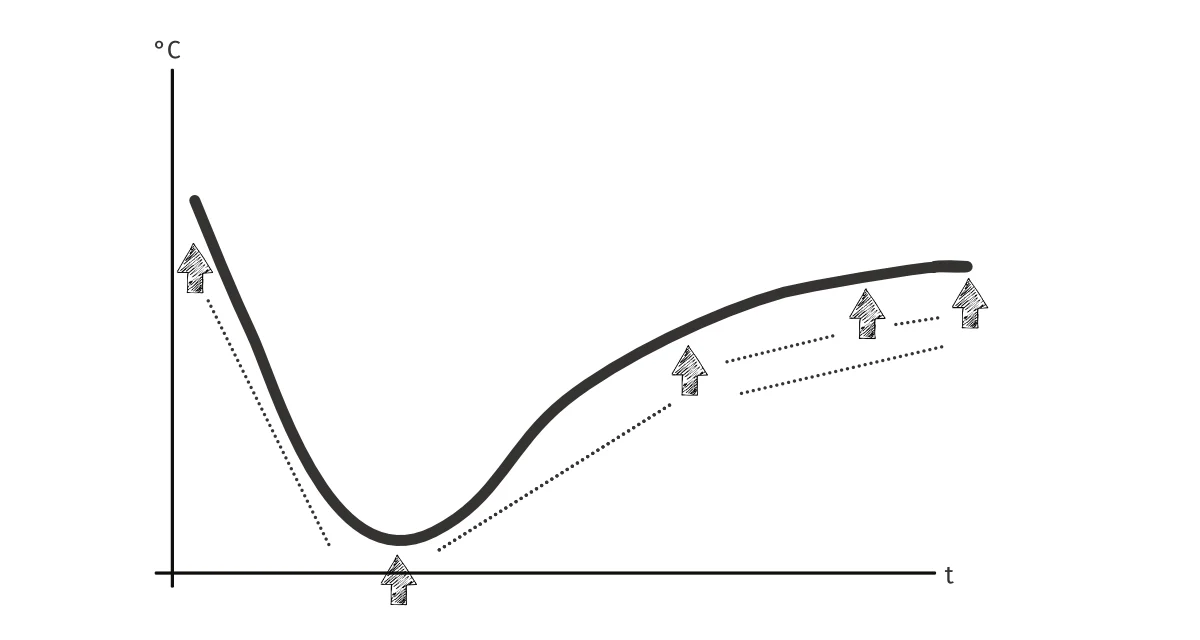
When we look at a roasting curve, we see a continuous line that somewhat resembles a hook: at first, the line drops steeply down to the right before changing direction and rising at a much shallower angle to the upper right.
By itself, this might not seem very spectacular— Is it worth taking a closer look at this curve?
You guessed it: yes, it is! This curve contains a wealth of information that can help us refine our roasting process.
Before we dive in, let’s clarify that this article focuses solely on bean temperature and its corresponding curve. A full roasting profile typically consists of multiple curves, such as air temperature or rate of rise. These require a broader analysis—one that we’ll explore in a future article.

Key Points in the Roasting Curve
From left to right, we first encounter the charge temperature, also known as the entry point. At the far right, we have the drop temperature, marking the end of the roast. Between these two, we see the point where the curve changes direction: the turning point.
As experienced roasters, we also recognize two more key moments: the first crack and the second crack.
That gives us five key points along the roasting curve, which we can name and measure in sequence:
- Charge temperature
- Turning point
- First crack
- Second crack
- Drop temperature
These key points already give us valuable data for our roasting process, as we can measure them precisely. This means we can assign a temperature and a timestamp to each event.
For example, the charge temperature might be 170°C (338°F), with a starting time of zero—since the clock only starts ticking when the beans enter the roaster.
Measuring Time Intervals, Not Just Events
We can measure not only individual points but also the time between them. One of the most well-known time intervals is the development time—the period between the first crack and the end of the roast.
This is where things get interesting: unlike isolated events (like the first or second crack), time intervals require two measurement points to form a relative value.
Think of it this way: knowing you’re on the fifth floor of a building doesn’t tell you much. But if you also know the building has only five floors, you immediately understand that you’re at the top.
The development time is often the most important interval we measure because it directly impacts the roast profile and final cup profile.
The Three Phases of Roasting
Some of these time intervals can also be described as phases. You’ve already encountered one: the development phase (also called Development Time, or “Dev” for short).
Before that, there are two other phases:
- The drying phase (also called the initial phase), which starts when the beans enter the roaster and lasts until shortly after the turning point.
- The Maillard phase, which begins after the turning point and continues until the roast is finished.
One thing as a side note: There is no definite starting or ending point of each phase. It’s more a fluent concept. The idea to seperate the phases in roasting helps us better understand each full roast. Yet, we can’s say: The drying phase always behaves like this. The division is more a helpful breakdown than an on-point-never-changing system.
To conclude: What Can We Measure?
We measure:
- Individual key points: Charge temperature, turning point, first crack, second crack, and drop temperature.
- Time intervals between key points, such as the development phase (the time between the first crack and the end of the roast).
What Numbers Won’t Tell You
Numbers from the roasting process provide valuable insights, but they don’t tell the whole story. For a complete quality assessment, we also need to measure roast color and evaluate the coffee through cupping.
Additionally, numbers alone don’t define the goal of a roast. Only we, as roasters, know who we’re roasting for and the intended purpose of the coffee.
7 Reasons Why Measurement Matters
Breaking down the roasting process into phases and measurable data might sound dry at first. But let’s take a closer look at why this structured approach is so valuable:
1. Consistent Roasting
Our goal is always a consistent, repeatable roast. This ensures that my Guatemala SHB tastes nearly the same this week and next week—and performs similarly in cupping.
2. Simplified Communication
Dividing the roasting process into phases and key points makes it easier to communicate with employees and fellow roasters.
3. Defining a Quality Tolerance
By tracking our numbers, we can define acceptable variations for quality control. Coffee is a natural product, so some variation is inevitable—but we can set limits.
4. Understanding the Roasting Process
Breaking down the chemical and physical reactions into phases helps us understand what’s happening inside the bean.
5. Quality Control, Part 1
Data from the roasting process is one part of comprehensive quality control. With defined tolerances, minor fluctuations won’t cause concern.
6. Error Correction
If something goes wrong, we can check our logs to pinpoint where the issue occurred and make adjustments.
7. Developing Roast Profiles
When working with a new coffee, we can use data to determine which adjustments might be necessary to achieve our desired profile.
Final Thoughts
By analyzing our roasting curve, we can identify key measurement points, assign temperatures and timestamps, and establish meaningful relationships between data points.
Through these measurements, we create a detailed roasting log, ensuring consistency and repeatability while making it easier to correct mistakes.
However, measurements alone don’t guarantee a perfect roast. True quality control also requires cupping and roast color evaluation.
And finally—no roasting process is one-size-fits-all. Only we, as roasters, truly understand the purpose and audience for each roast.